INTRODUCTION
In newborn males, posterior urethral valves (PUV) are the most common cause of lower urinary tract obstruction (LUTO), affecting 1 in every 5000 to 8000 live births, and accounting for roughly 60% of all LUTO cases.1 Cystoscopy and valve ablation via a transurethral incision (TUI), preferably within the first 4 to 16 weeks of life, is the definitive treatment for the bladder outlet obstruction (BOO), failure of which can result in severe urological sequelae involving both the upper and lower urinary tract.2 Despite the relief of the anatomical BOO through ablation, long-term follow-up is necessary as lower urinary tract dysfunction (LUTD) and renal damage have been found in up to 70% and 50% of cases respectively.2 This upper tract damage could be attributed to urethral stricture formation, the presence of residual valves, hypertrophy of the bladder neck, and/or overactivity and hypo compliance of detrusor muscles, all of which could occur following PUV ablation.2
Historically, the assessment of detrusor function post-PUV ablation relied primarily on symptomatology or radiographic abnormalities on voiding cystourethrogram (VCUG) and kidney-ureter-bladder (KUB) ultrasonography, with cystoscopy serving to exclude urethral stricture or residual valve leaflets.1 However, these modalities were inherently subjective. Comprehensive urodynamics emerged as the sole modality capable of giving accurate and objective insights into detrusor function and can be done repetitively to gauge post-intervention improvements.1 Uroflowmetry, the non-invasive component of UDS, is a simple, cost-effective modality for assessing bladder and urethral function that is widely used as a standalone examination to assess a child’s ability to empty the bladder and can, therefore, be used to evaluate the effectiveness of PUV ablation.3 Specifically, it can detect increased bladder outlet resistance by providing objective and quantitative data on free urinary flow rate throughout the micturition process by measuring the Qmax, voided volume (VV), flow pattern, and post-void residual volume (PVR).3
However, there is a paucity of data on the use of uroflowmetry as a follow-up study in paediatric patients after valve ablation in the African context, even though it is commonly advised as a first line in the assessment of LUTD.4 This study, therefore, aimed to establish uroflowmetry as a valuable and cost-effective technique for patient follow-up after valve ablation in a major referral hospital in Kenya by characterizing its patterns. Based on the findings, this study would help identify uroflowmetry as a tool for the early detection of LUTD, such as bladder dysfunction, a modifiable risk factor for renal damage, contribute to the pool of local data on the incidence of LUTD after valve ablation, and aid in the development of local guidelines and protocols for the management and follow-up of such patients.
METHODS
Study Design and Setting
This was a cross-sectional hospital-based study conducted at Kenyatta National Hospital (KNH), the National Referral Hospital located in Nairobi, Kenya. The hospital is equipped with both infrastructure and personnel that routinely manage PUV in children. The protocol for valve ablation in KNH is through a transurethral approach via a 9 Fr resectoscope on a cold knife. Valve ablation is done at 12, 5, and 7 o’clock positions. A Crede maneuver is subsequently performed to assess the adequacy of ablation, with a reassuring on-table stream considered adequate.
Study Population
As uroflowmetry is not routinely done as a follow-up test, the study recruited participants by recalling all patients who underwent PUV ablation at KNH between January 2014 and December 2020 and were currently on active follow-up in the unit’s outpatient clinic. Patients who had not completed toilet training were excluded.
Data collection
Primary data collection adhered to the “International Children’s Continence Society (ICCS) Standardization Report on Urodynamic Studies of the Lower Urinary Tract in Children.5” Demographic information, current urological symptoms, and medical history were recorded. Uroflowmetry was conducted in a dedicated Urology Centre near KNH with a digital automatic GRAVIMETRIC (Weight Type) Uroflowmeter (FLOW COMP ®, model 106). Two uroflow measurements were performed for each patient to ensure accuracy, avoiding morning uroflows to prevent atypical voiding volumes. Data collected included VV, Qmax, flow curve pattern, and PVR.5 Pre-void and post-void bladder volumes were estimated using sonographic evaluation, with a significant PVR defined as more than 20% of the pre-void urine volume. A single trained staff member who routinely performed uroflowmetry tests at the Urology Centre performed all the tests to maintain consistency. Expected Qmax values were calculated as the square root of estimated bladder capacity (EBC) for age.5 EBC (ml) was calculated by (age in years + 2) × 30 as the children were older than 2 years.6
Data Management and Analysis
Data accuracy was verified, imported into Microsoft Excel for cleaning, and analysed using IBM SPSS Statistics for Windows, Version 26.0. Categorical data were presented as frequencies and percentages, while continuous variables were analysed using means with standard deviation or medians with interquartile ranges. Relationships and differences within the dataset were explored using one-sample chi-square tests and paired sample t-tests. Data presentation was done through tables and graphs to facilitate interpretation.
Ethical considerations
Institution approval was sought and granted while ethical approval was obtained from Kenyatta National Hospital - University of Nairobi Ethics and Research Committee (KNH- UoN ERC) REF Number P369/04/2023. Written informed consent was obtained from all parents or guardians.
RESULTS
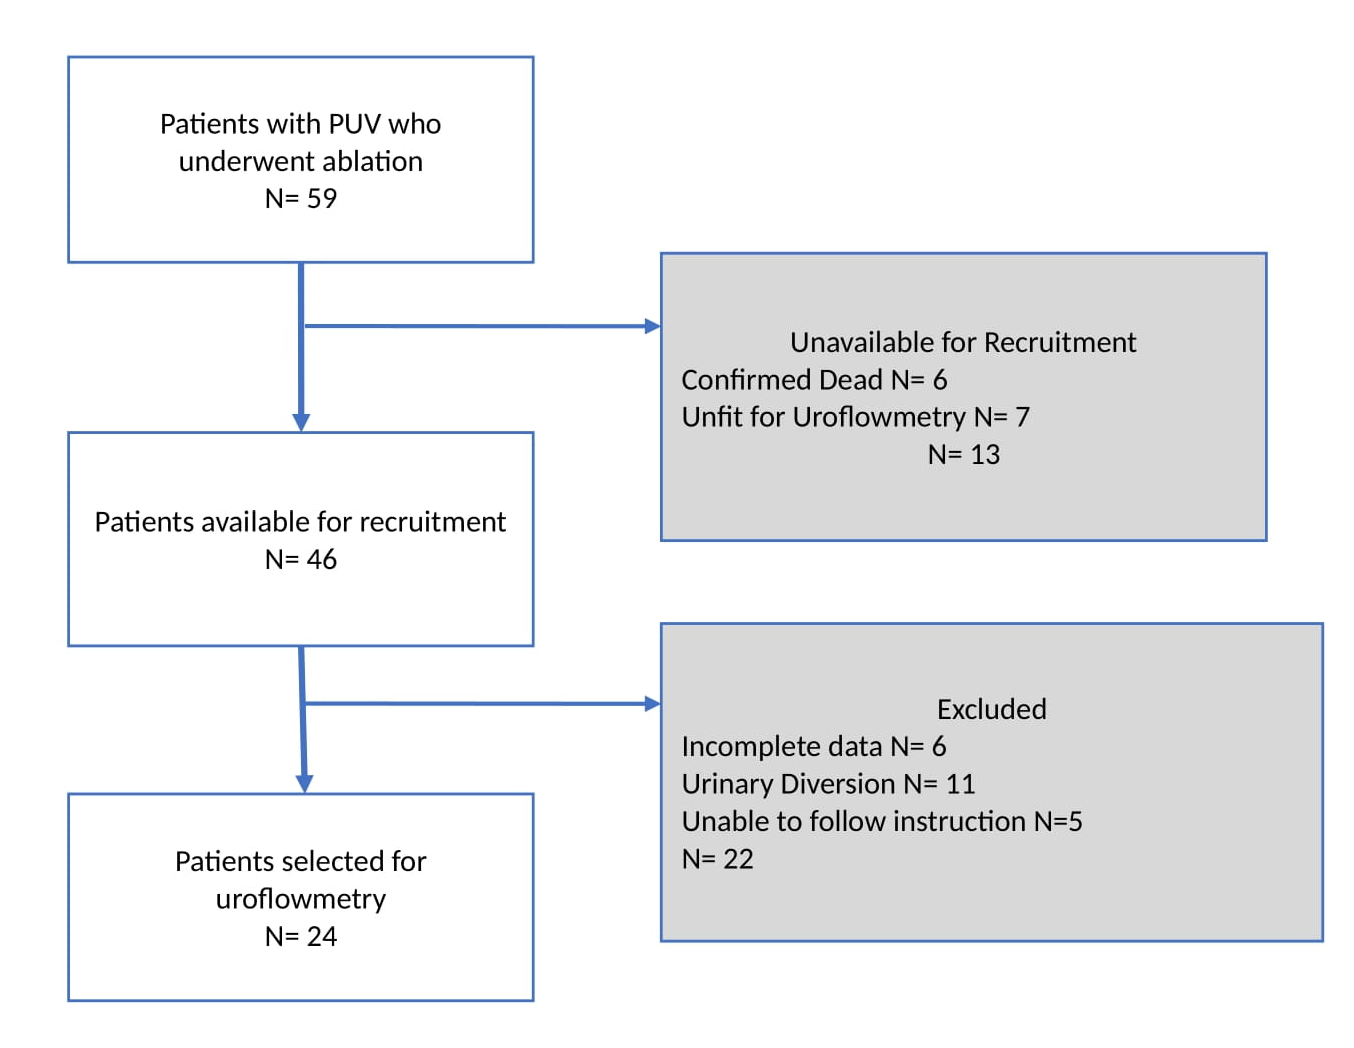
The data of this study consisted of 24 patients who underwent ablation of PUV at KNH between January 2014 and December 2020. The following flowchart (Figure 1) illustrates patient selection and factors contributing to the completion or non-completion of the uroflowmetry test among 59 eligible patients.

Sample Characteristics
Table 1 shows a summary of the demographic and clinical characteristics of the patients making up the sample. The mean age of the patients was 6.6 years (SD = 3.46). The mean age at diagnosis was 55.54 months (SD = 55.345, range = 1-224). The mean age at valve ablation was 57.42 months (SD = 54.810, range = 1-224), and the time gap between valve ablation and uroflowmetry was 38.04 months (SD = 14.97, range = 19-78)
Despite valve ablation, the boys experienced a range of LUTS, with terminal dribbling (25%) being the most common voiding symptom, frequency (29.2%) the most frequent storage symptom, and incomplete emptying (25%) the predominant post-micturition symptom (Table 2).
Uroflowmetry parameters
Voided Volume and Q max
The mean voided volume was 139.08 mL (SD = 90.028). The mean EBC was 257.08 mL (SD = 98.576). The mean expected Q max was 11.26 mL/s (SD = 3.59), while the mean observed Q max was 11.74 mL/s (SD = 5.24), as shown in Table 3.
A paired-sample t-test was conducted to compare the mean VV and the mean EBC in millilitres (mL) in paediatric patients following the ablation of PUV. The results showed a significant difference between the mean VV (M = 139.08, SD = 90.03) and the mean EBC (ml) (M = 257.08, SD = 98.58); t (23) = -11.34, p < 0.001, 95% CI [-139.52, -96.48] with the mean VV being significantly lower than the mean EBC as shown in Table 4.
A paired-sample t-test was also conducted to compare the mean observed and expected Q max following valve ablation. The results showed that there was no significant difference between the mean observed Q max (M = 11.74, SD = 5.24) and the mean expected Q max (M = 11.26, SD = 3.59); t (23) = -.537, p = .596, 95% CI [-2.35, 1.38] as shown in Table 4.
Post Void Residual
Sonographic assessment of bladder capacity post-micturition revealed a significant residual urine volume of more than 20% of pre-void bladder urine volume in 19 participants (79%) as shown in Table 5.
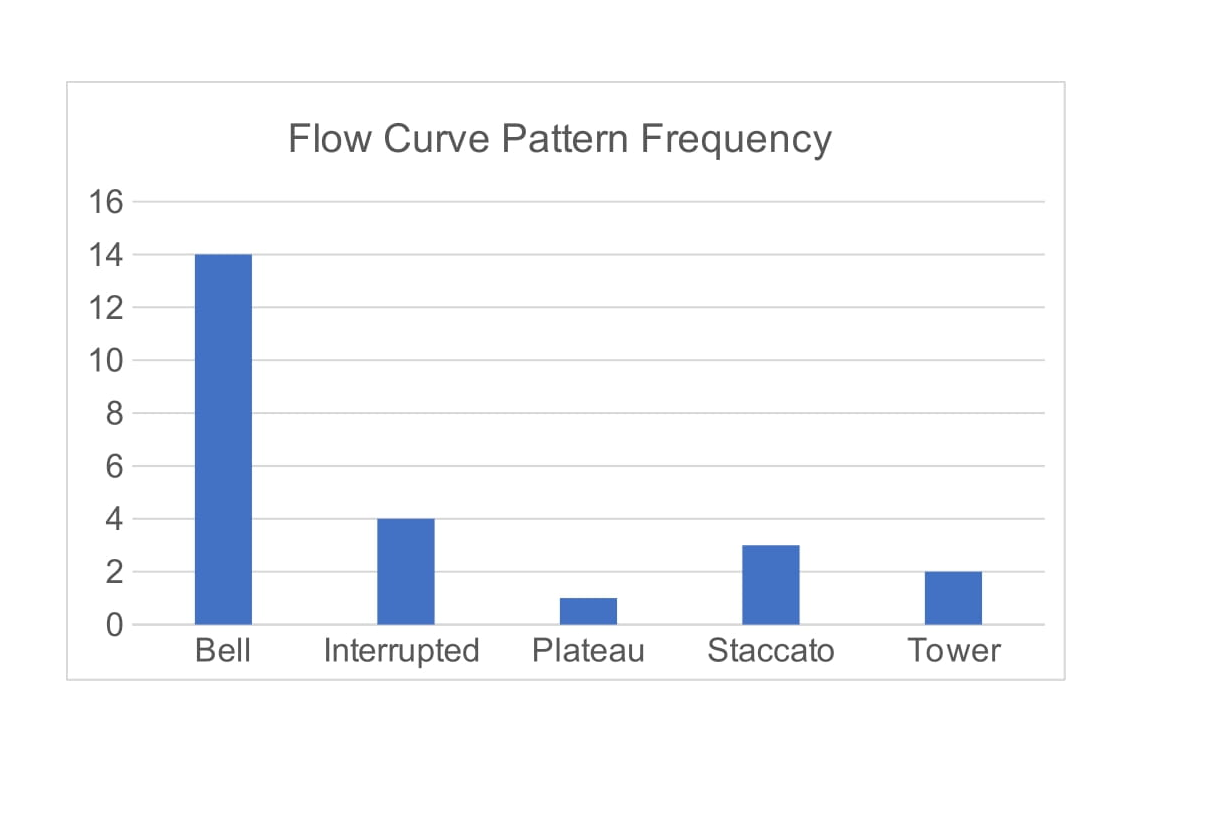
Uroflow curve patterns
The most common flow pattern observed was the bell-shaped curve (58.33 %) as shown in Figure 2.

One sample chi-square test was then conducted to compare the observed and expected frequencies of the flow pattern curves. The expected frequencies were based on the assumption that 50% of patients would exhibit a normal (bell-shaped) flow pattern, while the remaining 50% would be distributed equally among the four abnormal patterns (12.5% each).
The results showed a chi-square value =2.33 and a corresponding p-value=0.675 indicating no statistically significant differences between the observed and expected frequencies. This confirmed the null hypothesis that the distribution of flow patterns did not significantly deviate from the assumed proportions. The observed frequency of the bell-shaped flow pattern was 58.33%, which was not significantly higher than the expected frequency of 50%. The observed frequencies of the other flow patterns also did not differ significantly from their expected frequencies of 12.5%: staccato 12.50%, plateau 4.17%, tower 8.33%, and interrupted 16.67%.
DISCUSSION
The mean age at presentation and PUV diagnosis in this study was 55.4 months (4.61 years), indicating a significant delay in diagnosis, which is consistent with reports from other LMICs like Nigeria (mean age 3.95 years) and Cameroon (median age 1.8 years).7 Common barriers to early diagnosis in these settings include limited access to prenatal ultrasound, poverty, parental ignorance, and inadequate specialist care.7 In contrast, countries like Thailand and Iran report earlier detection, with a median age of 4.8 months in Thailand and 67% of cases in Iran diagnosed within the first month of life, largely due to increased utilization of prenatal ultrasound.8 In our study, most patients underwent valve ablation later than in other series, highlighting delays in detection and referral commonly seen in LMICs.7,8
One important factor influencing renal outcomes has been identified as the age at valve ablation.9 Early age at valve ablation improves renal outcomes and lowers the risk of end-stage renal disease (ESRD), while delayed ablation increases the risk of ESRD by 10% due to the effects of chronic BOO-induced bladder dysfunction.10,11 For example, Youssif et al. found better resolution of hydroureteronephrosis and bladder function on urodynamics in patients who underwent neonatal valve ablation compared to those treated after one year.12 In our study, we observed that the majority of the boys presented with LUTS, including terminal dribbling, frequency, and incomplete emptying, indicative of underlying bladder dysfunction owing to delayed presentation and, consequently, valve ablation. However, despite the later-than-expected time at diagnoses, ablation was done promptly after diagnosis, with a mean age of 57.42 months, demonstrating timely action and the availability of specialists to manage PUV. Furthermore, the gap between ablation and uroflowmetry of 38.04 months may have also altered bladder dynamics, with a longer delay between ablation and urodynamics being associated with a higher prevalence of bladder dysfunction.9 Bladder dysfunction is a common irreversible comorbidity in patients with PUV post-ablation, occurring in about 55%.2 It is caused by chronic obstruction, which disrupts normal bladder cycling and causes bladder wall modifications such as muscle hypertrophy and fibrotic remodelling, eventually leading to an unyielding bladder with elevated resting pressure and decreased bladder capacity. Ultimately, the bladder hostility worsens hydroureteronephrosis, and gradually, renal failure develops.13–17
Our findings revealed that the observed Qmax did not substantially differ from the mean expected Qmax values, indicating a favourable outcome of valve ablation in terms of restoring urethral patency, which can otherwise be obstructed by remaining valves, strictures, or bladder neck stenosis.18 Additionally, we discovered that in the 24 boys who underwent ablation, the mean VV post-ablation was significantly lower than the mean EBC, suggesting either a decrease in bladder capacity or an increase in PVR. To better understand which of the two was most likely, PVR was calculated by subtracting the mean pre-void volume (279.05mls) from the mean actual voided urine as per uroflowmetry (129.52mls). It was then observed that 19 boys (79%) showed a considerably high mean PVR (149.52 mls). Existing urodynamic literature on PUV mainly focuses on comprehensive evaluations of bladder function pre- and post-ablation, with limited studies examining uroflowmetry parameters alone, albeit diverse findings.19 For example, Ipekci et al. performed pre- and post-ablation uroflowmetry on 52 patients aged 5 to 17 years and discovered that the majority (80.7%) reported a significant decrease in PVR and an improvement in Qmax postoperatively, indicating better drainage, while the other 19.3 % who had increased PVR but no equivalent increase in Qmax required additional procedures due to remnant valves or urethral strictures.20 In contrast, findings from Mo et al. showed no significant disparities between pre- and post-valve ablation uroflowmetry values for PVR (81 vs 64 mls), maximal bladder capacity (149 vs 167 ml), and Qmax (6 vs 8 ml/s), suggesting that valve ablation did not restore nor improve bladder function.19 Other previous investigations have found a significant increase in the incidence of PVR among patients with PUV post-ablation, with three theories being detailed concerning PVR in the absence of bladder outlet obstruction21,22. The first theory proposes a true residual caused by a hypo-contractile overdistended bladder causing incomplete emptying. The second theory is that pseudo-residuals are caused by urine reflux into the upper tract, which then refills the bladder after voiding. The third explanation is pseudo-pseudo-residuals from a hydronephrotic polyuric kidney.23–25 Although our study lacked pre-ablative uroflowmetry parameters for comparison, a high PVR was observed in 19 boys (79%), which was most likely due to a combination of true, pseudo, and pseudo-pseudo residual urine, with mechanical obstruction being unlikely given the average recorded Qmax. To determine which of the three was the primary cause of the PVR, additional procedures such as VCUG, cystography, or the Whitaker test would have been required.24 The remaining 5 boys had no significant PVR, as their mean pre-void bladder capacity (190 mls) matched their mean actual voided volume (175.4 mls), indicating normal detrusor contractility and no mechanical obstruction.
The flow pattern curve analysis revealed that majority of the boys, 58.3%, had a normal (bell-shaped) flow pattern while 41.7 % had abnormal curves. A normal flow pattern is frequently associated with both low intraurethral pressure and normal detrusor contractility.5 Conversely, while the flow pattern may help identify the mechanism underlying LUTD, neither a typical nor abnormal pattern guarantees the presence of LUTD due to compensatory voiding mechanisms such as the use of abdominal muscles.5 As a result, it is impossible to determine whether our participants had a normal curve pattern due to normal detrusor contractions or if it was caused by a urinary system compensating mechanism. The flow pattern curve analysis should, therefore, not be read separately but in conjunction with the Qmax since combining the two provides a better knowledge of lower urinary tract function and can aid in the identification of patients who may require additional intervention or treatment.26
STUDY STRENGTHS AND LIMITATIONS
The study recruited participants from a specialized referral centre with a standardized protocol for PUV ablation, ensuring consistent surgical and post-operative practices. It followed the ICCS standards, with a single trained staff member conducting all uroflowmetry tests to maintain reliability. However, the study also faced several limitations. The small sample size and study design were not powered to make conclusive inferences on the subject under study. While the results provide important insights into the post-ablation urodynamic effects in PUV patients, further prospective research with larger, more representative samples is necessary to confirm these findings and enhance their generalizability. Additionally, while uroflowmetry is a helpful non-invasive tool, its results can be influenced by factors such as hydration status, diurnal variation, psychological state, and environmental conditions, particularly in paediatric patients. These limitations suggest the need for more invasive urodynamic tests to detect subtle abnormalities.
CONCLUSION
Uroflowmetry did not find any statistically significant difference between the mean expected and observed Q max in our cohort of patients after PUV ablation, suggesting adequate urethral patency after ablation. However, 79% of participants had significant residual urine volume, and 41.7% had abnormal uroflowmetry curves, which suggested significant bladder dysfunction. Incorporation of uroflowmetry as a routine follow-up metric in LMIC protocols can, therefore, provide useful adjuncts in detecting bladder dysfunction after posterior urethral valve ablation. Uroflowmetry seems a valuable non-invasive adjunct to follow-up in PUV management.
Acknowledgments
The authors would like to thank the RCSI/COSECSA Collaboration Programme Global Surgery Research Support 2023/2024 for funding this study. We are also grateful to the Urology Centre for enabling us to perform uroflowmetry on our patients.