Introduction
Acute appendicitis is one of the most common causes of acute abdominal pain requiring emergency surgical intervention.1 According to Addiss DG et al, males are slightly more affected by this pain than females, with a lifetime risk of 8.6% for males and 6.7% for females, respectively.2 Overall, approximately 8% of the population will experience appendicitis, most commonly during the second or third decade of life.2
In 1894, McBurney described the surgical removal of an inflamed appendix through an open incision in the right lower quadrant, a procedure now known as an open appendectomy (OA).3 Nearly a century later, in 1983, Semm introduced the laparoscopic appendectomy (LA) as a minimally invasive alternative.4 This technique uses smaller skin incisions and has since gained popularity due to its advantages over the open approach. In 1991, Nowzaradan et al highlighted that minimally invasive techniques like LA offered superior outcomes compared to the OA.5,6 While the LA has become the gold standard in high-income countries (HICs), its implementation remains limited in low-income countries (LICs), raising concerns about feasibility and accessibility.7
A review by Clarke et al of major electronic databases aimed to identify studies from South Africa published between 2000 and 2023 that examined the incidence, presentation, diagnosis, and outcomes of acute appendicitis. The findings reported an increasing incidence of appendicitis in South Africa.6
Although there are increases in the use of technology in different surgical techniques, OA continues to be the first surgical method, particularly in public health care limited settings. This shows a disparity in access to laparoscopic surgery. Additionally, better patient outcomes were observed in private centers that used LA compared to public facilities relying on the open approach. Clarke concluded that improving health care infrastructure, enhancing surgical training, and promoting equitable access to laparoscopic surgery are essential priorities.6,8 Numerous studies have compared the advantages of LA vs OA in the management of acute appendicitis.7,9–11
This systematic review and meta-analysis aims to compare LA and OA in low-resource settings in terms of operative time, postoperative complications, hospital stays, return to normal activity, and costs related to procedures.
Methods
The study followed the Preferred Reporting Items for Systematic Reviews and Meta-analyses (PRISMA) 2020 guidelines as well as the Cochrane Handbook for Systematic Reviews of Interventions. The PRISMA 2020 checklist, comprising 27 items, was used to ensure methodological rigor and transparency.12
Eligibility criteria
Randomized controlled trials (RCTs), observational studies (cohort studies and case-control studies), studies comparing LA and OA, and studies conducted in low-resource settings (ie, low- and middle-income countries (LMICs)) were all included for this review
Studies conducted in high-resource settings, studies involving pediatric populations only, studies comparing conservative vs surgical management, case reports or case series, and studies not comparing LA and OA were excluded.
Information sources
A comprehensive search was conducted using the following electronic databases: PubMed, Cochrane Library, Embase, Scopus, African Journals Online, and WHO Global Index Medicus. Further search was done using search terms and manual searches. We considered only studies published in English, and the timeline from January 2014 to December 2024 was considered. The final search was performed on December 31, 2024.
Search strategy
The search strategy was developed using the Patient or Problem Intervention Comparison Outcome (PICO) framework and adapted for each database to retrieve the most relevant articles.
Keywords and Medical Subject Headings (MeSH) terms included “laparoscopic appendectomy,” “open appendectomy,” “limited resource settings,” “low- and middle-income countries,” “clinical outcomes,” and “cost-effectiveness.” Search terms were combined using Boolean operators (“AND”, “OR”) to refine results based on PICO.
The full search string is available in the supplementary file.
Study selection process
Two independent reviewers (RT, JLM) screened all titles and abstracts retrieved from the searches using Covidence. Each reviewer classified articles as “include” or “exclude.” Disagreements were resolved by a third adjudicating reviewer (AB).
Full-text articles of potentially eligible studies were reviewed independently by both reviewers to assess compliance with inclusion and exclusion criteria. Reasons for exclusion were documented for transparency. The study selection process was reported in a PRISMA 2020 flow diagram.
Data collection process and data items
A standardized data extraction form was developed to collect key study information. Extracted data included:
-
Study characteristics: authors, year of publication, study design, setting, and sample size;
-
Population characteristics: age, gender, and comorbidities;
-
Intervention details: surgical technique (LA or OA); and
-
Outcomes: postoperative complications, length of hospital stay, operative time, mortality, and cost.
Data collection forms were pilot tested on 2 studies, and discrepancies were resolved by discussion with a third reviewer.
Additional data, such as funding sources, country income classification, and health care setting, were extracted to assess contextual differences.
Study risk of bias assessment
Randomized controlled trials were assessed using the Cochrane Risk of Bias tool (RoB 2), which assesses 5 domains of bias in randomized controlled trials: (1) the randomization process, which examines the sequence generation and allocation concealment; (2) deviation from intended interventions, including adherence and blinding; (3) missing outcome data, considering the completeness of outcome reporting; (4) measurement of the outcome, addressing outcome assessor blinding and validity of outcome measurement; and (5) selection of the reported results, which evaluates selective reporting and outcome switching. Each domain is independently rated as presenting:
-
Low risk: the study meets the domain criteria with minimal chance of bias affecting the results;
-
Some concern: potential issues exist that may raise doubts about bias, but are not sufficiently categorized as high risk; and
-
High risk of bias: there is a significant risk that bias in the domain may have affected the study findings.
Observational studies were assessed using the Newcastle-Ottawa Scale (NOS), which provides a structured framework for appraising both cohort and case-control studies with an adapted version for cross-sectional designs. It employs 3 key methodological domains: selection (up to 4 stars) that assesses the representativeness and ascertainment of the study groups, including the adequacy of case definition, selection of controls, and demonstration that outcome of interest was not present at the start of the study; comparability (up to 2 stars) that evaluates the extent to which the study design or analysis has controlled for confounding factors; and outcome for cohort studies or exposure for case-control studies (up to 3 stars) that examines outcome assessment, adequacy of follow-up, and nonresponse or ascertainment of exposure. Studies scoring 7–9 stars were considered low risk of bias, 4–6 stars indicated some concern, and 0–3 stars reflected a high risk of bias.
Bias domains included selection, performance, detection, attrition, and reporting. Risk of bias assessment was conducted independently by 2 reviewers with conflicts resolved by a third reviewer.
Effect measures
For dichotomous outcomes, odds ratios (ORs) with 95% confidence intervals (CIs) were used.
For continuous outcomes, mean differences (MDs) or standardized mean differences (SMDs) with 95% CIs were calculated.
Synthesis methods
Qualitative synthesis involved a narrative summary of the study characteristics and findings.
Quantitative synthesis (meta-analysis) was conducted if data were sufficiently homogeneous using SPSS version 29. A random-effects model was used to account for heterogeneity.
Effect sizes were presented as ORs for dichotomous outcomes, cohen’s D for continuous outcomes, and 95% CIs for all estimates. Where required, standard deviations were estimated from standard errors or interquartile ranges using Cochrane formulas.
Heterogeneity was assessed using the I² statistic, with interpretation as follows:
-
0–40%: low heterogeneity,
-
40–60%: moderate heterogeneity,
-
60–80%: substantial heterogeneity, and
-
80–100%: considerable heterogeneity.
Subgroup analyses explored heterogeneity by study design (eg, RCT vs observational study).
Publication bias was not evaluated as assessed outcomes had less than 10 studies. We used SPSS version 29 to synthesize results. Predefined subgroup analyses were planned based on study types. We did subgroup analyses between RCTs and observational studies.
Certainty of evidence for each outcome was evaluated using the Grading of Recommendations Assessment, Development and Evaluation (GRADE) approach, which considered study limitations, consistency, directness, precision, and publication bias.
Results
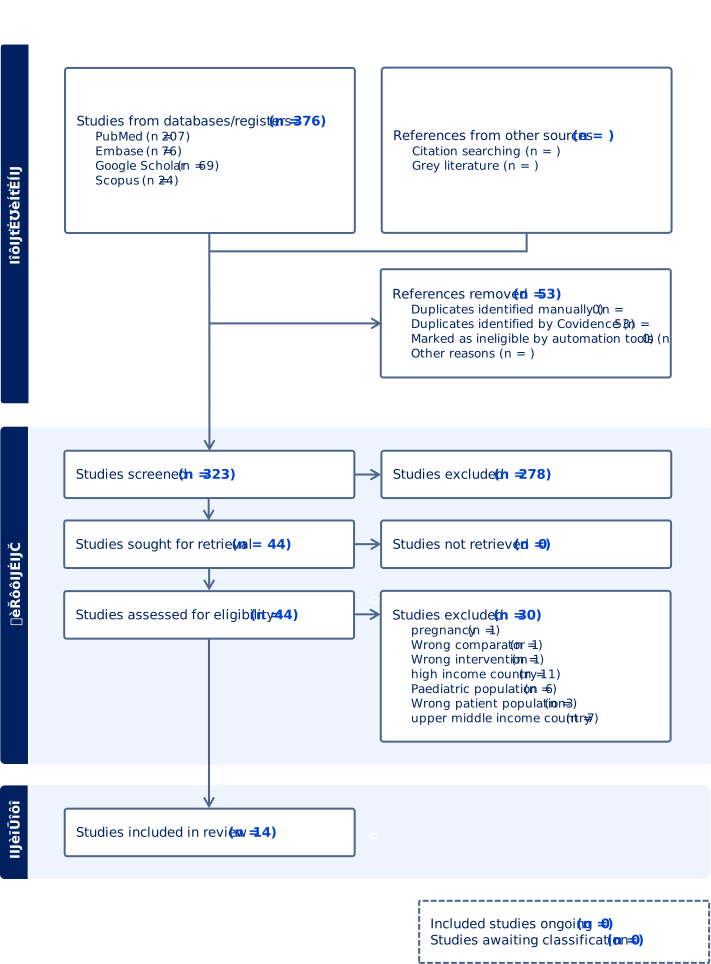
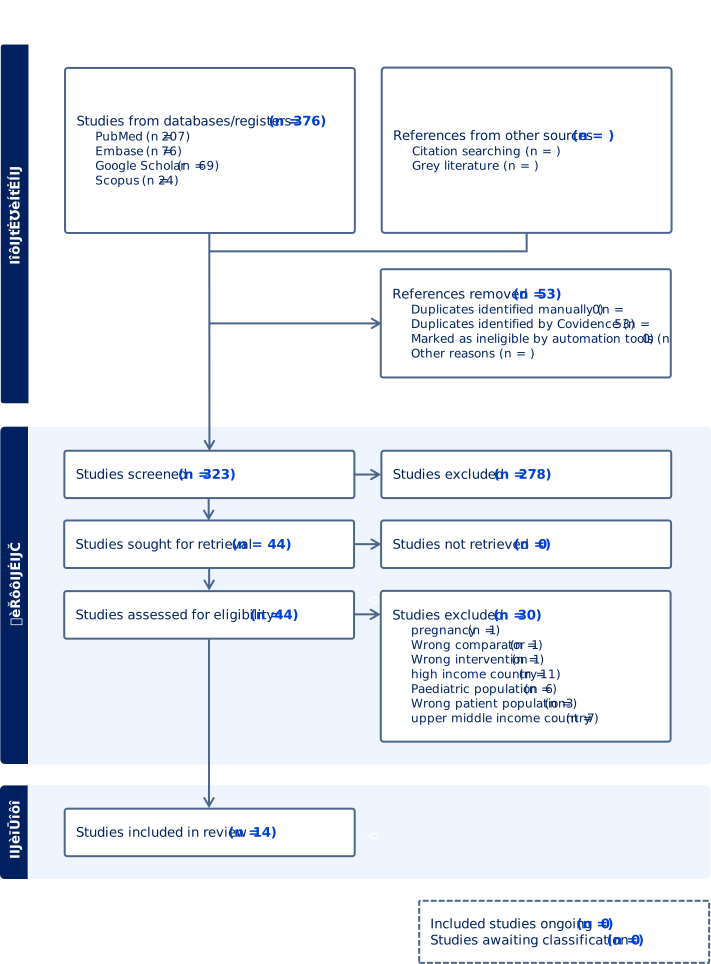
A systematic literature review was conducted using multiple databases, including PubMed, Google Scholar, Web of Science, Scopus, Embase, and Africa Journals Online. The search results were imported into COVIDENCE for systematic screening, which was conducted in 3 phases: title screening, abstract screening, and full-text review.
The selection process is illustrated in Figure 1, in accordance with the PRISMA 2020 flow diagram. After removing duplicates and applying the inclusion and exclusion criteria, a total of 14 studies were included in the final review. Reasons for excluding studies assessed for eligibility were: pregnancy (n = 1), wrong comparison (n = 1), wrong intervention (n = 1), HIC (n = 11), upper-middle-income country (n = 7), focusing on pediatric population (n = 6), and wrong population mixing pediatric and adult population (n = 3).
Risk of bias assessment
The methodological quality of the included studies was assessed using standardized tools. For RCTs, the Cochrane Risk of Bias tool (RoB 2) was used. For observational studies (cohort and case-control), the NOS was applied. NOS was used to assess the methodological quality and bias risk of nonrandomized studies. It assesses 3 important domains: outcome (or exposure), comparability, and outcome.
Initially, a total of 14 studies (6 RCTs and 8 observational studies) were evaluated for risk of bias, and 12 were included in the meta-analysis after risk of bias assessment (6 RCTs and 6 observational studies). The results of the RoB 2 assessment for the RCTs are presented in the table available in supplementary files.
All 6 randomized controlled trials were rated as low risk or with some concerns. No study was rated as having a high risk of bias in any domain. This indicates generally acceptable methodological quality across the RCTs included in this review.
Eight observational studies were evaluated, 6 were included based on acceptable quality, while 2 studies (Shakya and Naidoo) were excluded due to an overall high risk of bias. The NOS assessment criteria addressed representation of the exposed cohort, selection of the nonexposed cohort, ascertainment of exposure, outcome status at baseline, and comparability based on design or analysis. A table summarizing the risk of bias is available in the supplementary file.
Characteristics of included studies
After assessing for the risk of bias, we included 12 studies (2014–2024) from 7 LMICs (Nigeria, Sudan, Iran, Pakistan, India, Egypt, and Nepal) with a total of 1897 patients. The designs of the included studies are 6 RCTs and 6 prospective cohort studies. Sample sizes of the studies included ranged from 40 to 550 patients. Most studies included patients with acute or uncomplicated appendicitis who met specific age criteria. Primary outcomes assessed were surgical site infection (SSI) (11 studies: 6 RCTs and 5 observational), length of hospital stay (7 studies: 3 RCTs and 4 observational), postoperative pain (5 studies: 2 RCTs and 3 observational), return to work (4 studies: 1 RCT and 3 observational), cost (5 studies: 1 RCT and 4 observational), and operative duration (6 studies: 3 RCTs and 3 observational). Further details of the studies are in Table 1.
The total number of participants included in this systematic review and meta-analysis was 1897. Of these, 754 (40.9%) were male and 1091 (59.1%) were female. Sex was not reported for the remaining 52 patients in the study done by Nepal et al A total of 873 patients (46.1%) underwent LA, while 1024 patients (53.9%) underwent OA. All demographic details are included and noted in Table 1.
Table 1 represents characteristics of 12 included studies such as author descriptions, study methods, demographics, and study outcomes in each study. Return to normal activity reported by Abass et al as categorical percentages and not pooled with continuous outcomes. Karatparambil et al reported a return to normal activity as percentages instead of days. Mukherjee et al reported a return to normal activity in hours, which were converted to days.
Primary outcomes
In this study, no publication bias assessment was done due to small number of included studies per the outcomes examined. All outcomes reported less than 10 studies, which is the ideal number for publication bias assessment.
Operative time
Randomized control trial
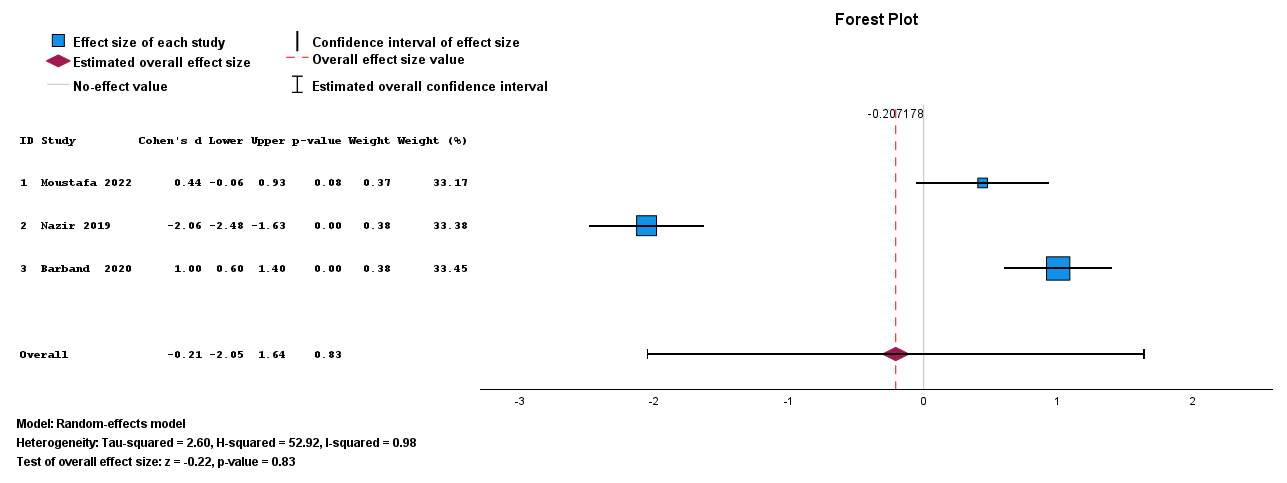
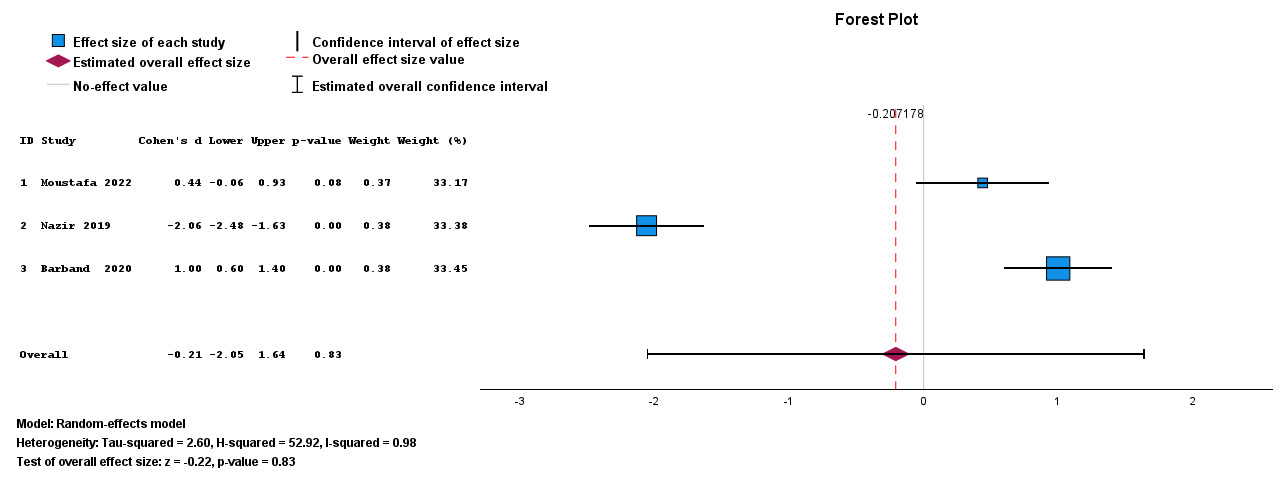
Figure 2 presents a forest plot of operative time from 3 RCTs; the estimated effect size favors LA. Overall, Cohen’s d was -0.21, 95% CI -2.05–1.64 showed no clear difference and was nonstatistically significant between LA and OA. The heterogeneity was high (I² = 98%), indicating considerable variability among the included RCTs.
Observational studies
Three studies were analyzed for operative time: the effect size in this analysis favors OA. Overall, a Cohen’s d of 0.91 indicated that operative time was longer in LA compared to OA. Notably, the heterogeneity was negligible (I² = 0%), indicating consistency across studies. The forest plot is in the supplementary files.
Surgical site infection (SSI)
Randomized control trial
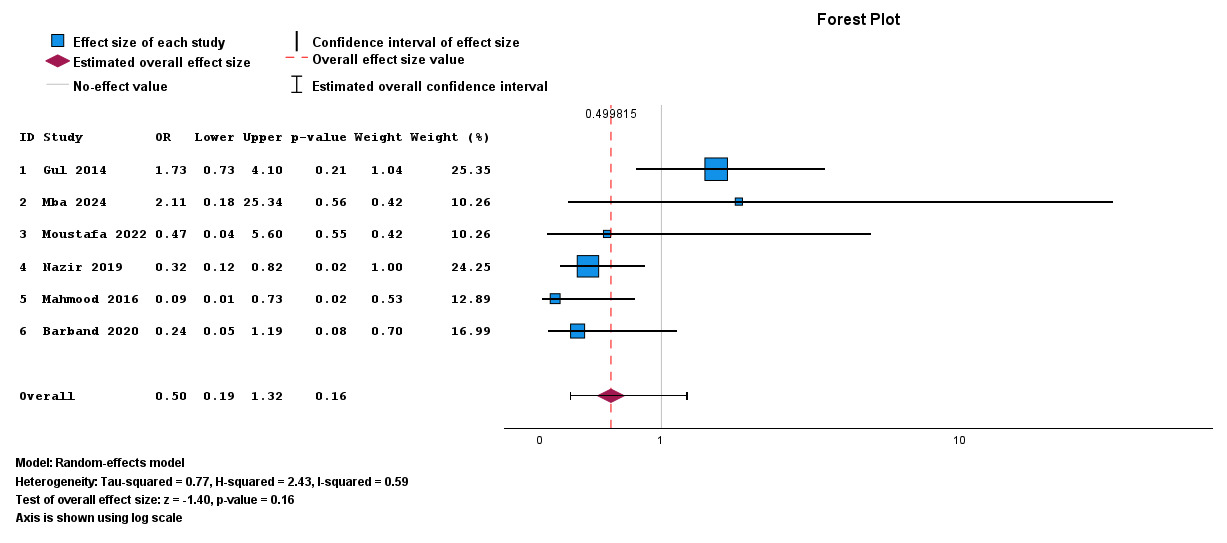
Figure 3 presents the forest plot for 6 RCTs, the estimated effect size favors LA. Overall, an OR of 0.50 with 95% CI 0.19–1.32 indicated a lower risk of SSI in LA (50% reduction) compared to OA, which is not statistically significant as the upper bound (1.32) crosses the line of null effect. Moderate heterogeneity was observed (I² = 59%), suggesting some variability among the included RCTs.
_based_on_data_from_rcts._six_rcts_were_inclu.png)
Observational studies
The meta-analysis of 5 observational studies showed that SSI was common in OA. Overall, an OR of 0.64 indicated that there is a lower risk of SSI (36% reduction) compared with OA. The level of heterogeneity was low (I² = 19%), which suggests consistency across the included observational studies. The forest plot is available in the supplementary file.
Hospital stay
Randomized controlled trial
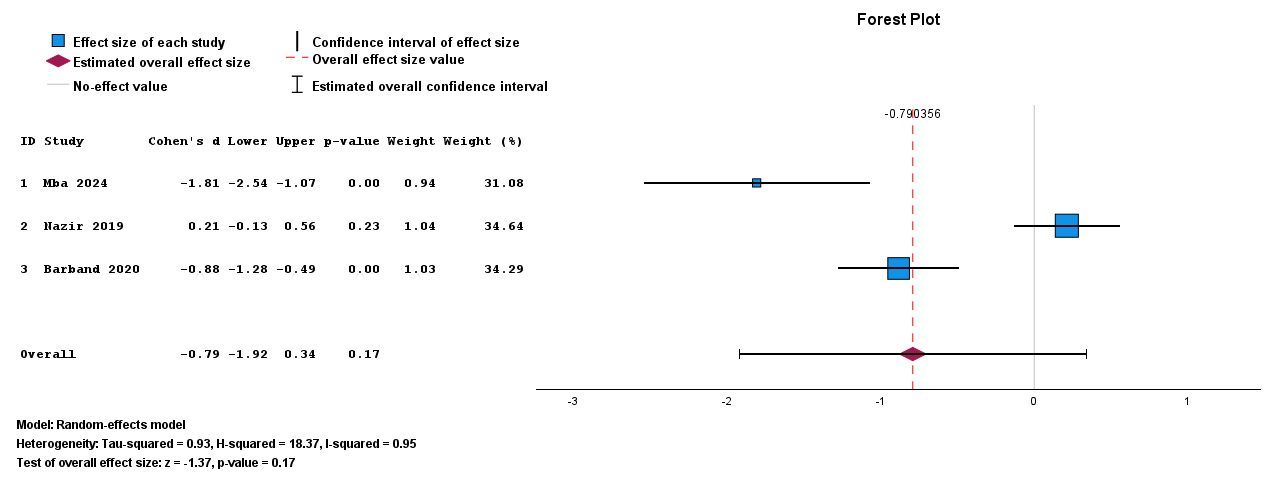
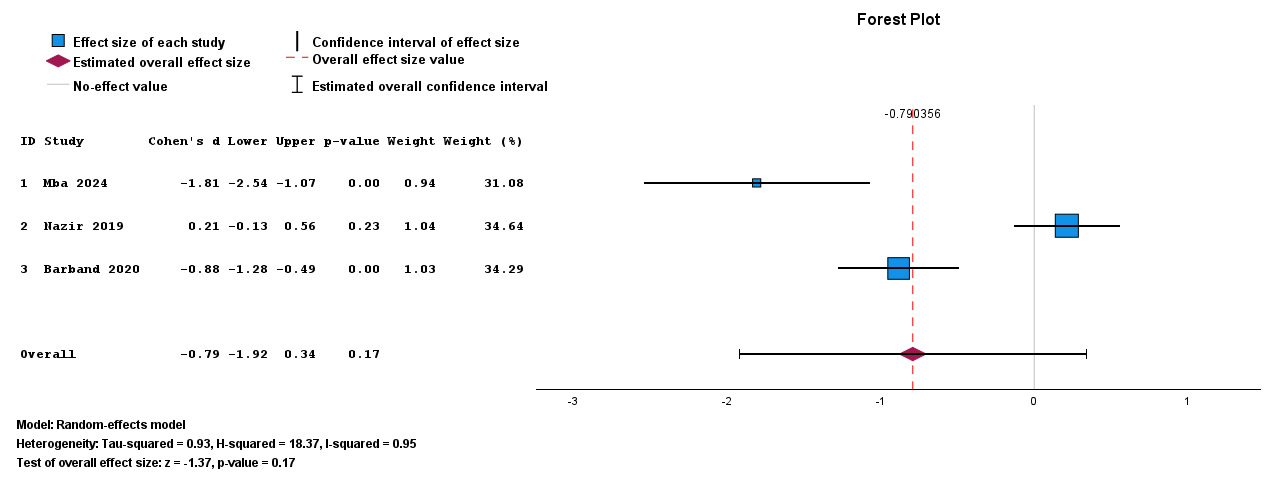
Figure 4 presents the forest plot for RCT for hospital stay, the meta-analysis indicates an estimated effect size favoring LA. A Cohen’s d of -0.79 indicate a shorter hospital stay in LA when compared to OA with 95% CI -1.92–0.34, which is not statistically significant as the confidence interval crosses the line of null effect. Considerable heterogeneity was observed (I² = 95%).
Observational studies
The meta-analysis was performed in 4 observation studies for hospital stay. Overall, a Cohen’s d of -1.32 indicated that hospital stay length in LA was shorter than in OA. However, it is not statistically significant at a conventional p-value of 0.05 and an estimated overall effect size of CI -2.67–0.03 crossing the line of null effect. The heterogeneity was high (I² = 97%). The forest plot illustrating this is accessible in the supplementary file.
Return to normal activity
Randomized controlled trial
According to Mba et al, patients who underwent LA returned to normal activities significantly earlier (4.6 ± 1.5 days) than those undergoing OA (9.7 ± 3.5 days).
Observational studies
In a meta-analysis of 3 studies (Kathare et al, Mukherjee et al, and Adisa et al), the estimated overall effect size significantly favors LA. Overall, a Cohen’s d of -1.37 indicated that the time to return to activity after LA was shorter than after OA. However, heterogeneity was substantial (I² = 94%). The forest plot illustrating this is accessible in the supplementary file.
Pain score
Randomized controlled trial
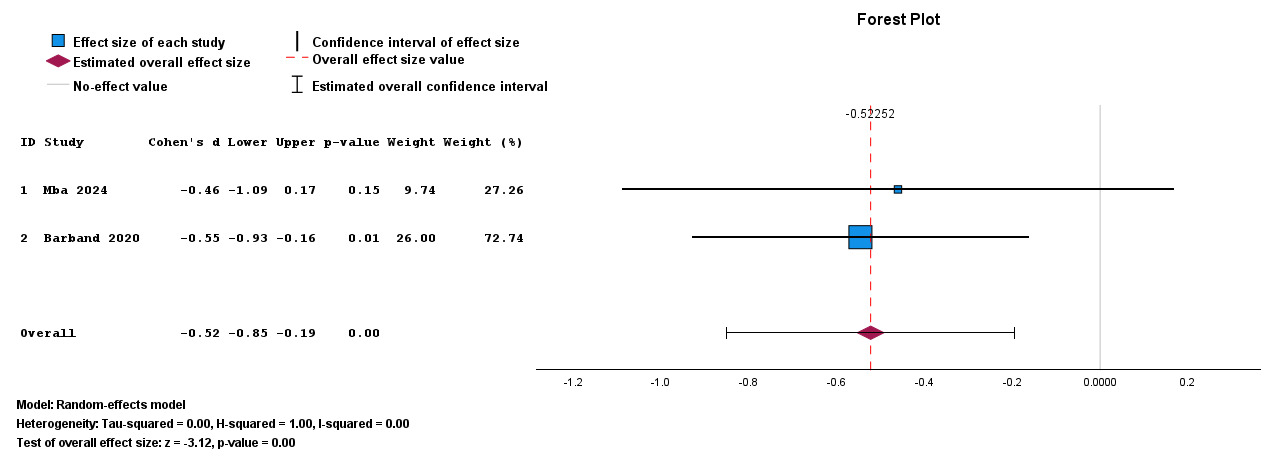
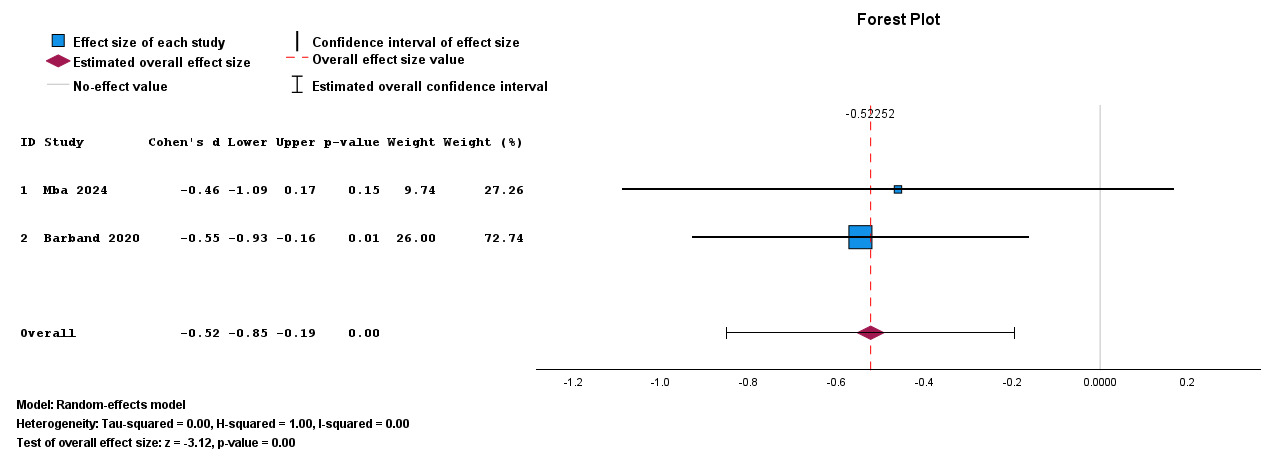
Figure 5 presents the forest plot describing the pain score in 2 RCTs. In this meta-analysis of 2 RCTs (Mba et al, Barband et al), the estimated overall effect size favors LA, which is statistically significant with a P value closer to 0.0018. The LA has lower pain scores than the OA, with an overall Cohen’s d of -0.52, 95% CI -0.85–0.19. Heterogeneity was negligible (I² = 0%). The forest plot illustrating this is accessible in the supplementary file.
Observational studies
In a meta-analysis of three studies (Kathare et al, Mukherjee et al., and Karatparambil et al), the LA had lower pain scores than the OA. The estimated overall effect size favors LA in a statistically significant way with an overall Cohen’s d of -1.82, 95% CI -3.75–0.12. There was substantial heterogeneity (I² = 98%). The forest plot illustrating this is accessible in the supplementary file.
Cost
Randomized controlled trial
According to Mba et al, the mean cost of LA was 142.6 ± 1.7 USD compared to 110.8 ± 3.1 USD for OA, indicating higher costs associated with laparoscopic procedures.
Observational studies
According to the meta-analysis of 4 observational studies (Kathare et al, Adisa et al, and Karatparambil et al, Nepal et al), the overall effect size favors OA. Overall, the Cohen’s d of 1.99, 95% CI 1.16–2.82 indicated that the procedure cost in LA was higher than that of the OA and statistically significant. The forest plot illustrating this is accessible in the supplementary file.
Assessment of certainty in the body of evidence using GRADE
Certainty of evidence was assessed using GRADE. It was moderate for postoperative pain, SSI, and return to normal activity. However, it was low for operative time, hospital stay, and cost outcomes. Most RCTs have a low risk of bias, and some observational studies have unclear confounding control. There is considerable heterogeneity in operative time (both in RCTs and observational studies), hospital stay (both in RCTs and observational studies), return to normal activity (observational studies), postoperative pain score (observational studies), and cost (observational studies). Minimal population and interventions were determined for the LMIC context. Some outcomes had wide CIs crossing the line of effect (eg, operative time, cost). A table explaining this in detail is available in the supplementary file.
Discussion
The guidelines for acute appendicitis published by the World Society of Emergency Surgery recommend that laparoscopic appendectomy be the preferred operation in settings where adequate equipment and skilled surgeons are available.13 This meta-analysis aimed to compare laparoscopic appendectomy with the open appendectomy approach.
In our study, several point estimates favored laparoscopic appendectomy, and confidence intervals crossed the line of no effect with considerable heterogeneity for outcomes such as operative time and hospital stay. Interpretation considered variability in surgical expertise, equipment availability and quality, and study designs in LMIC settings.
Our study showed a predominance of female patients (1091; 59.1%) compared to males (754; 40.9%), consistent with previous studies.7,13,14 that also reported female predominance. This trend may be related to diagnostic challenges in females of childbearing age, where gynecological conditions can mimic appendicitis. However, in a study by Shaikh et al., males comprised 35 (72.9%) to female 13 (27.1%) in laparoscopic appendectomy, and males 34 (65.4%) and females 18 (34.6%) in open appendectomy, and the difference was not statistically significant p=0.51.16
Among the participants, 53.9% underwent open appendectomy, while 46.1% had laparoscopic appendectomy. This distribution indicates that laparoscopic appendectomy is increasingly recognized as a safe and feasible option in health care facilities in resource-limited settings, such as in the study by Shaikh et al., where laparoscopic appendectomy was performed on 48 (48%) and open appendectomy on 52 (52%). Siddiqui et al. reported that in 2004, only 13% were laparoscopic appendectomy operations, which increased to 100% in 2015.16,17
In our meta-analysis of randomized controlled trials, operative time for laparoscopic appendectomy was slightly longer than that of open appendectomy, though this difference was not statistically significant. This finding aligns with previous studies such as Nazir et al. and Barband et al.19,20 Observational studies showed no significant difference in operative times between the two approaches. The longer operative times reported in the study by Otoki et al. reflect the surgeon’s learning curve and limited laparoscopic experience in low-resource settings.21
Meta-analysis of RCTs favored LA over OA in a low rate of SSI, which is consistent with other studies, such as Moustafa et al. Nazir etal. Barband et al. and Mahmood et al.19,20,23,24 and different from Gul et al.15 However, observational studies did not find a significant difference in SSI rates.13,25–27 Reported SSIs in the laparoscopic group were sometimes due to postoperative hematoma and intra-abdominal abscesses, possibly linked to limited surgeon experience or suboptimal laparoscopic equipment.
LA was associated with shorter hospital stays in observational studies, allowing patients to be discharged earlier than after open appendectomy. Other observational studies not used in this study have shown similar results, such as studies by Yau et al. and Kumar et al.28,29 Meta-analysis of RCTs showed shorter length of hospital stay, differing from the results by a study by Nazir et al., where the mean hospital stay was longer in LA than OA.19 The expected early ambulation and reduced postoperative pain after laparoscopy are likely to contribute to shorter hospital stays.
In our study, one randomized controlled study by Mba et al. showed that the patients who underwent a laparoscopic appendectomy returned to normal activity earlier than those who underwent OA.18 Meta-analysis of observational studies showed that patients who underwent LA returned earlier to their normal activities than those who underwent open appendectomy. Kumar et al. reported earlier return to activity for patients who underwent laparoscopic appendectomy (11.5 days) than OA.28 Patients undergoing laparoscopic appendectomy returned to normal activities significantly sooner than those who had open appendectomy, consistent with Mustafa et al.23 This benefit is likely due to smaller wounds, reduced pain, and less tissue trauma with laparoscopy.
In our study, the pain score for LA was notably lower than that of OA. Meta-analysis of RCTs and observational studies showed significantly lower postoperative pain scores in patients undergoing LA compared to OA. The pain score is associated with analgesic requirement, where laparoscopic appendectomy required a lower dose of analgesics, as reported in other studies, such as Abass et al., who reported that there was a significant occurrence of severe pain requiring opiate analgesia (p=0.000, r=62.7, df=2).
In this study, an RCT by Mba et al. showed that LA was more expensive than OA, and a meta-analysis of observational studies reported that the cost was higher in LA than in OA. Other observational studies report the high cost of LA.13,22,26,27 A study by Kayondo et al. reported that the medical cost of LA was 167.1 USD, with a 21.4% increased cost compared to OA, 137.61 USD.30 On the contrary, Otoki et al. showed that the total costs of LA cases were lower (33.39 USD) than those of open appendectomy(40.41 USD), with the additional benefit of shorter hospital stay and lower surgical site infections.21 These cost analyses typically consider only hospital admission to discharge and may not capture broader social costs, such as earlier return to work and reduced postoperative complications, which might favor laparoscopy in a comprehensive economic evaluation.
From the previously mentioned outcomes, which reported the benefits of LA and OA. In limited resource settings such as sub-Saharan Africa, Southern America, and southern East Asian countries, there is a remarkable implementation gap for laparoscopy. Yankunze et al. highlighted low utilization of minimally invasive techniques in surgical training in the East, Central, and Southern Africa (ECSA) region, where laparoscopic cases remain a minority.31 A study done by a GlobalSurg collaborative on laparoscopic in management of appendicitis in high, middle, and low income countries showed that laparoscopic approach was associated with better outcomes in high human development index countries and advocate introduction of laparoscopy as it was associated with fewer overall complications (OR 0.23 95% CI 0.11-0.44) and SSI (OR 0.21 95% 0.09-0.45) after propensity-score matched-groups for low-middle-HDI matched.32
This review is limited by small sample sizes and potential publication bias due to English-only inclusion. The findings from this systematic review and meta-analysis support prioritizing laparoscopic training and procurement programs in LMIC policies.
Conclusion
In this study, the findings are consistent with LA having several potential benefits compared to OA in LMIC settings, such as shorter hospital stays, early returns to normal activity, and lower SSI rates. There is no consistent statistical significance across all analyses with substantial heterogeneity for several outcomes. There is a remarkable direct high cost associated with LA. Where laparoscopy is available in LMIC settings, it has been shown to be safe, but the evidence does not support declaring it as gold standard in these settings. Our findings highlight a significant limit of high-quality data from LMICs and show an urgent need for further research to improve surgical training and evaluate context-specific health economics.
Ethical Approval
Not applicable
Informed Consent
Not applicable
Data Availability
All data underlying this review, including extracted datasets and analytic code, are available upon request to the main author/corresponding author.
Conflict of Interest
None
Funding
None